Are you struggling to stay motivated and keep track of your progress? What if there was a simple tool that could boost your drive and make your goals feel more real?
Progress graphs do exactly that. They turn your efforts into visible, clear results that encourage you to keep going. You’ll discover how using progress graphs can change the way you approach your goals—and help you stay motivated every step of the way.
Ready to see your progress in action and feel more inspired than ever? Let’s dive in.
Why Progress Graphs Work
Seeing your progress laid out clearly can change how you feel about your goals. Progress graphs do more than just show numbers—they tap into your motivation by making your journey visible. Understanding why these graphs work can help you use them better to keep pushing forward.
Visualizing Achievements
When you visualize your achievements on a graph, you make your success real. Instead of vague hopes, you get concrete proof of what you’ve done. This clear picture helps you recognize how far you’ve come, turning abstract goals into visible milestones.
Imagine tracking your daily steps in a graph. Watching the line climb steadily feels rewarding, right? That visual feedback pushes you to take another step, literally and figuratively.
Tracking Small Wins
Big goals can feel overwhelming, but progress graphs break them down into smaller, manageable wins. Each small rise on the graph is a win you can celebrate. These little victories add up, keeping your motivation alive.
Have you ever noticed how ticking off a small task feels satisfying? Progress graphs give you that same feeling constantly, reminding you that every effort counts.
Boosting Confidence
Seeing steady progress boosts your confidence because it shows you are capable. It’s easy to doubt yourself when results seem slow, but a graph highlights consistent effort. This visible proof helps silence self-doubt and keeps you focused on growth.
Think about a time you felt stuck. Did looking back at what you’ve already achieved help you move forward? Progress graphs serve that role every day, reinforcing your belief in your own abilities.
Choosing The Right Graph Type
Choosing the right graph type helps show your progress clearly. Bar graphs work well for tracking daily goals, while line graphs highlight changes over time. Clear visuals keep motivation strong and goals in focus.
Choosing the right graph type can significantly impact your motivation journey. It’s all about how you visualize your progress. Different graph types serve distinct purposes, and selecting the right one can make tracking your goals a more empowering experience.Line Graphs For Trends
Line graphs are perfect for showing changes over time. They help you see patterns and trends in your progress. If you’re tracking weight loss or savings growth, a line graph can be your best friend. Watching the line move upwards or downwards can be incredibly motivating. It provides a clear picture of where you stand and where you need to go. Ever had that moment when you thought you weren’t making progress, but then the graph tells a different story?Bar Graphs For Comparisons
Bar graphs excel at comparing different categories. If you want to measure performance across various tasks or goals, this graph type is ideal. It visually displays differences, making it easier to pinpoint areas needing improvement. Imagine having set monthly sales targets and seeing how each month stacks up against the others. The visual impact of bars rising and falling can motivate you to push harder. Have you ever felt the satisfaction of seeing one bar finally surpass the others?Pie Charts For Proportions
Pie charts are great for understanding proportions. They offer a snapshot of how different components contribute to a whole. If you’re dividing time between activities or budgeting, pie charts give a clear perspective. Seeing a large slice dedicated to leisure might prompt a reevaluation of priorities. They can trigger a moment of self-reflection. Are your slices balanced, or is one area consuming more than it should? Choosing the right graph type can keep you motivated and focused. What type of graph will you choose to visualize your journey?Setting Clear Goals
Setting clear goals is the first step to use progress graphs effectively. Clear goals give your progress a direction and purpose. They help you see what success looks like and keep you focused. Without clear goals, tracking progress can feel confusing and less motivating.
Defining Measurable Targets
Measurable targets mean you can count or track your progress. Instead of saying, “I want to get better,” say, “I want to run 3 miles in 30 minutes.” This way, your progress graph shows real changes. Measurable targets make your goals concrete. They show exactly what you want to achieve. This clarity helps keep your motivation high.
Breaking Goals Into Steps
Big goals can seem hard or far away. Break them into smaller, clear steps. Each step should be easy to measure and reach. For example, if your goal is to read 12 books a year, break it into one book per month. Your progress graph can track these smaller wins. Each small success feels rewarding and pushes you forward.
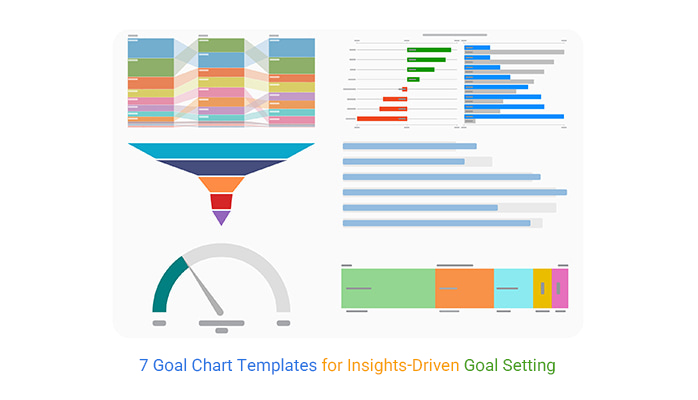
Credit: chartexpo.com
Creating Your Progress Graph
Creating your progress graph is a powerful way to see how far you have come. It turns your efforts into a clear visual story. Watching your progress grow can boost your motivation and keep you focused.
Making a progress graph is simple. You just need the right tools, a clear design, and regular updates. These parts work together to keep your graph useful and inspiring.
Selecting Tools And Apps
Choose tools that suit your style and skill. Some people prefer paper and pen for a hands-on feel. Others like digital apps for easy updates and sharing.
- Simple spreadsheets like Excel or Google Sheets work well.
- Apps like Trello or Habitica help track daily goals.
- Specialized graphing apps like Canva or ChartGo offer visual options.
Pick a tool that feels easy and fun. This helps you stay consistent over time.
Designing For Clarity
Keep your graph clear and easy to read. Use simple lines, bars, or dots to show progress. Avoid clutter or too many colors.
- Label your axes clearly with dates and goals.
- Use contrasting colors for better visibility.
- Add a short title that explains the graph’s purpose.
A clear design lets you understand your progress at a glance. It also makes the graph more motivating.
Updating Regularly
Set a schedule to update your graph. Daily or weekly updates work best for most goals. Regular updates keep your progress fresh and real.
- Mark new achievements as they happen.
- Adjust your goals if needed to stay realistic.
- Review your graph to celebrate small wins.
Regular updates turn your graph into a living record. It helps you stay on track and motivated every day.
Using Graphs To Stay Motivated
Using progress graphs to stay motivated turns abstract goals into visible achievements. When you see your efforts charted out, it becomes easier to understand how far you’ve come and what’s left to do. This visual feedback keeps your energy up and your focus sharp.
Celebrating Milestones
Marking milestones on your graph gives you clear moments to celebrate. These checkpoints show real progress, not just distant success. Every time you hit a milestone, take a moment to acknowledge it—this small reward boosts your motivation to keep going.
For instance, if you’re tracking daily writing, seeing a steady rise in word count encourages you to maintain the streak. What small win will you celebrate today?
Adjusting Goals Based On Data
Your progress graph is a feedback tool, not just a record. If you notice a plateau or drop, it’s a signal to rethink your approach. Maybe your goal was too ambitious or the timeline too tight.
Use the data to tweak your targets. This flexibility prevents frustration and helps you set realistic, achievable goals. How often do you review your progress and adjust your plans?
Maintaining Consistency
Graphs highlight patterns in your work habits. Seeing gaps or irregular progress encourages you to build a routine. Consistency is easier when you can visually track your daily or weekly efforts.
Try setting simple daily targets and watch your graph climb steadily. How can you create a habit that reflects positively on your progress chart every day?

Credit: www.reddit.com
Overcoming Motivation Slumps
Motivation slumps are a natural part of any progress journey. They can feel frustrating and make you question your efforts. However, using progress graphs can help you spot these dips early and push through them effectively.
Identifying Plateaus
Progress graphs reveal when your improvement stalls. Instead of guessing why you feel stuck, look at your data points. Are they flatlining over days or weeks? This visual cue helps you recognize plateaus quickly.
Once identified, ask yourself: Is this a sign to adjust my approach or just a temporary pause? Understanding this makes your slump less mysterious and more manageable.
Reframing Setbacks
Seeing a downward trend on your graph can be discouraging. But what if you viewed setbacks as valuable feedback instead of failures?
Use your graph to analyze what caused the drop—maybe a change in routine or unexpected obstacles. This shifts your mindset from frustration to problem-solving, making motivation easier to regain.
Seeking Support
Sometimes a slump feels heavier when you go through it alone. Sharing your progress graph with a friend, coach, or community can bring fresh perspectives.
- They might spot patterns you missed.
- They can celebrate small wins with you.
- They provide encouragement when your motivation dips.
Who in your circle can help you stay accountable and motivated when the graph isn’t moving as you want?
Success Stories With Progress Graphs
Success stories with progress graphs show real proof of motivation. These stories highlight how simple visuals help track growth and keep focus. They inspire by showing clear results and steady improvement over time.
Progress graphs turn abstract goals into visible steps. Watching progress rise builds confidence and pushes people to keep going. These stories come from different areas, proving graphs work for many goals.
Personal Growth Examples
Many people use progress graphs to improve habits or skills. A language learner tracks new words learned each day. The steady climb on the graph brings a sense of achievement.
A runner logs daily miles, seeing clear gains in endurance. This visual proof helps fight laziness and stay consistent. Tracking weight loss or healthy meals also motivates by showing real progress.
- Tracking reading pages daily improves study habits.
- Recording meditation minutes builds mental strength.
- Charting savings growth encourages financial discipline.
Workplace Achievements
Progress graphs work well in a job setting. Employees track project milestones, sales, or skill development. Seeing targets met on a graph boosts morale and focus.
Managers use graphs to show team progress, sparking healthy competition. Visual data helps identify strengths and areas needing work. This clarity drives better results and teamwork.
- Sales reps monitor monthly targets and close rates.
- Developers track bug fixes or features completed.
- Customer service measures response times and satisfaction scores.
Credit: medium.com
Frequently Asked Questions
How Do Progress Graphs Boost Motivation Effectively?
Progress graphs visually track your achievements, making progress clear. This boosts motivation by showing real results and encouraging continued effort. Seeing improvement helps maintain focus and drives you to reach your goals faster and with greater confidence.
What Types Of Progress Graphs Work Best For Motivation?
Line graphs, bar charts, and habit trackers work best. They clearly display incremental progress and highlight trends over time. Choose a graph type that matches your goal and is easy to update regularly for consistent motivation.
How Often Should I Update My Progress Graph?
Update your progress graph daily or weekly for best results. Frequent updates keep motivation high and provide immediate feedback. This helps you adjust strategies quickly and stay committed to your goals.
Can Digital Tools Enhance Progress Graph Motivation?
Yes, digital tools offer customizable templates and reminders. Apps can automatically track data and provide insights. They make updating and analyzing progress easier, which strengthens motivation and accountability.
Conclusion
Tracking progress with graphs helps keep motivation strong. Seeing small wins on a graph feels rewarding. It shows how far you have come. This makes it easier to stay focused. Set clear goals and update your graph often. Celebrate progress, no matter the size.
Progress graphs make your journey visible and real. Keep using them to stay on track. Motivation grows when you see steady improvement. Try this simple tool to boost your drive every day.